JASMINE OO
Strategy ✤ Research ✤ Design ✤ Innovation
Using strategy and human-centered research to design experiences, services,
and products that help people navigate a changing world.

I am an experience strategist and, over the last 9+ years, I’ve built my career understanding how people, systems, and environments come together to shape experiences.
Through research, strategy, and design, I help organizations connect human behavior, business priorities, and operational realities to create experiences that are thoughtful for the people using them and practical for the teams bringing them to life.
The selected work below offers a glimpse into the range of industries, disciplines, and experiences I’ve helped shape from products and services to the broader ecosystems that bring them to life.
Some project details and deliverables are confidential.
If you’re interested in going deeper, please get in touch to access the full case studies and additional materials.
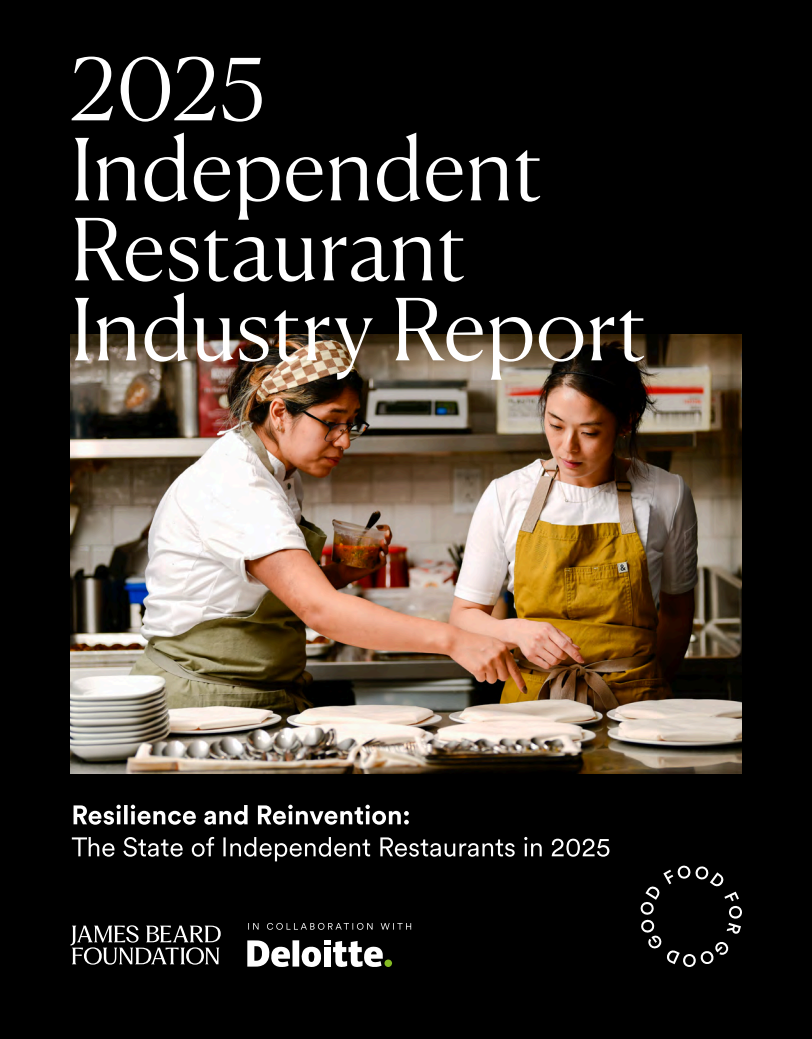


James Beard Foundation Annual Independent Restaurant Industry Report
(2025 + 2026)
National Survey Design
Chef & Operator Interviews
Focus Group Facilitation
Trend Synthesis
Executive Report Writing
INDUSTRY RESEARCH + RESEARCH LEADERSHIP
Finding New Growth in a Familiar Category
Macro & Cultural Trend Analysis
Stakeholder Interviews
Quantitative Survey
Qualitative Consumer Research
Concept Prioritization
Growth Strategy Roadmapping
CONSUMER & CULTURAL RESEARCH
+ INNOVATION STRATEGY
CHALLENGE
Customization was something customers consistently said they wanted, but a Fortune 50 technology company started to notice that very few of their customers actually do it. Freedom to customize was this operating system's whole pitch, but that same freedom put the burden of figuring it out on the user, and once that burden got heavy enough, people just defaulted to whatever came out of the box. The first phase of research pointed to a second, related pattern — not disinterest, but inertia. Once someone found a setup that worked, changing it meant relearning something new, and undoing a mistake wasn't always obvious.
"I have to do the same things a couple times to finally get it the way I want. The tweaks are necessary but time-consuming and frustrating." — Customer Interview
PROCESS
The research moved through three phases (foundational, qualitative, and large-scale quantitative), each answering a different research question that built on the one before it. Early-stage, large-scale focus groups surveyed the general population to understand what customers sought to feel and achieve through customization. Interviews and documentary-style fieldwork then surfaced the occasions and use cases customization actually served, revealing that people valued customization but resisted the effort and uncertainty of changing a familiar setup. Candidate opportunities narrowed at each stage, from 100+ generated in early fieldwork, to 50+ validated with the client team, to a final 12 the quantitative phase would test.
That global quantitative phase used a sparse MaxDiff design paired with TURF analysis across three markets (US, Japan, and Germany) to find which combination of features would reach the broadest share of customers, not just which single feature scored highest. It surfaced a timing pattern the team hadn't seen before: customization peaks in the first three months of ownership, then drops off the longer someone owns the device.
OUTCOME
Customization stopped being a collection of features and became something closer to a relationship that adapts over time; product strategy shifted toward timing suggestions tied to real moments in someone's ownership, not generic embellishment options.
The behavioral principles and journey maps I translated the findings into gave the product team a way to decide when a personalized recommendation should actually appear, aimed at lifting adoption (the percent of customers who customize a given feature) and confidence (how capable people felt doing it themselves) on the customer side. The data handed the business case its own number, too. Sustained customization engagement was correlated with a lower likelihood of churn, which gave the recommendation a retention argument as well as an experience one.
Reframing Customization as an Adaptive Experience
MIXED METHOD UX RESEARCH
+ DIGITAL PRODUCT STRATEGY
Global Mixed-Method Research
Quantitative Survey Analysis
Behavioral Principles
Future-State Product Concepts
Product Strategy & Roadmapping
Turning Delivery Day Into the Start of an Ownership Relationship
CX RESEARCH + EXPERIENCE DESIGN
Service Blueprinting
Dealer & Customer Experience Design
Journey Mapping
Secret Shopping
Experience Prototyping & Testing
Experience Simulations
Turning a Self-Service Financing Process Into a Guided One
CX RESEARCH + DIGITAL PRODUCT STRATEGY
Customer Journey Mapping
Generative Customer Interviews
Competitive Market Scan & Benchmark
Stakeholder Co-Creation Workshops
Future-State Concept Design
Activation Roadmapping
How do you give people the confidence to do things themselves without making them figure everything out themselves?
CHALLENGE
Customers shopping for, financing, and paying off a vehicle were doing most of that work themselves because dealers and lenders had given them reason to stop trusting anyone else to do it. They also experienced the dealership, manufacturer, and its financing arm as a single brand, but disconnected systems created duplicate steps and delays right at onboarding and lease-end. A leading automotive finance company came to us to understand where their digital experience was falling short and rebuild it around guidance, not just self-sufficiency.
"If I could have done this in the app, I would have done this myself. I told the representative, 'Can you tell whoever is listening that I am capable of doing this myself? I just can't...'" — Customer Interview
PROCESS
We paired an audit of the existing web and mobile experience with generative customer interviews to understand why customers kept reacting to friction with distrust. A structured observations-to-insights-to-implications synthesis surfaced five distinct experience themes, and underneath all five sat the same root cause: customers were doing coordination work the company should have been doing for them.
We brought together UX research, digital product, marketing, dealer services, and voice-of-customer so the people who'd need to build and defend the solution helped shape it from the start. Persona-anchored journey mapping turned the research into a shared framework, and five future-state concepts followed, benchmarked against best-in-class digital experiences from outside automotive finance, including an AI-assisted guide built to act on a customer's behalf.
Every concept then had to earn its place on the roadmap; we scored each one against customer-experience impact and operational complexity, and mapped what still needed validating before committing engineering time.
OUTCOME
The design and product team walked away with a shared, persona-grounded journey map framework instead of siloed assumptions, detailed enough to move straight into execution. The work shifted the experience strategy from improving individual touchpoints to reducing customer effort across the financing journey, creating opportunities to increase digital application completion and qualified leads.
SELECTED WORK
How do you design experiences that give people the confidence to move forward without making them figure everything out themselves?
CHALLENGE
A long-established luxury automotive manufacturer was about to deliver its first electric vehicle, through a dealer network that had sold and delivered cars the same way for decades. Customers didn't yet know what to expect from EV ownership, but the harder problem sat on the other side of the counter: dealerships had their own established habits about how a delivery worked, and some of what the new process asked of them ran against those directly. Delivery day ended up carrying all of it at once (education, paperwork, and the moment of seeing the car for the first time) because nothing upstream, on either side of the relationship, had been designed to handle any of that first.
"Public charging doesn't charge that fast… I don't know, man, they haven't given us information on this." — Dealership Sales Consultant Interview
PROCESS
The client's working assumption was that delivery day itself was the problem. Our team pushed back on that and tested it against what actually happened across the full EV ownership journey, not just delivery day: heuristic evaluation of the digital sign-up flows customers used for home and public charging, interviews with the charging-network and installation partners behind those flows, mystery shopping at both the manufacturer's own dealerships and competitor luxury EV brands, live delivery-day simulations with staff debriefs right after, and follow-up interviews with customers who'd hit a stalled-charge or no-start problem after taking the car home. The point was to see what was designed to happen against what actually did.
Findings alone weren't going to move the client to action, so we synthesized three things side by side: what the fieldwork surfaced, a set of simple internal principles for the experience, and a benchmark of how top-tier luxury brands were closing similar gaps for their own customers. Getting dealerships to actually adopt it meant working against habits that had nothing to do with EVs specifically, and everything to do with how deliveries had always been run.
OUTCOME
Delivery time fell from the industry's 3–4 hour standard to 1.5 hours as dealer practices shifted in the near term. The manufacturer's longer-term brand standards for EV competency followed close behind. Dealer EV-competency ratings and EV service revenue were the numbers on the business side the reframing was meant to protect, but the more telling shift showed up with customers, where Net Promoter Score moved because people came away actually trusting the experience, not just tolerating it. Delivery day stopped being the design target; the full ownership relationship took its place, for this launch and the ones that would follow.
How do you design products that adapt to people instead of asking people to adapt to them?
How do you redesign an experience when the biggest problems are hidden deep in the operations behind the scenes?
CHALLENGE
More than 95% of a nationally recognized academic healthcare system's home-care products (including equipment for hospice patients) moved through one facility, and for the first time in over 15 years, the organization had a chance to redesign it. What looked like a warehouse-layout problem was actually a systems problem: fragmented workflows, disconnected teams, and operational decisions that were invisible to the people downstream, and ultimately to patients.
PROCESS
Workflow friction and disconnects between teams show up in what people do, not what they say about their jobs — especially in an organization where warehouse staff, dispatchers, drivers, nurses, and pharmacists rarely see each other's work at all. So we built the research around direct observation, not just interviews: contextual inquiry, including riding along with delivery drivers to see the patient-facing end of a process the warehouse team never otherwise witnessed. A secondary research and market scan of comparable health systems gave us an outside standard for "good," rather than relying on internal opinion.
"Incorrect supplies are causing us a lot of stress… when the supplies are not there, that will mess up the whole day." - Nurse Interview
From there, we organized the findings into five root-cause themes tagged each to whether the fix lived in space, process, communication, or technology, and brought those themes to a working session with organization leadership to validate priorities before translating any of it into design principles, so the eight principles that followed were something leadership had already weighed in on, not a research team's recommendations landing cold.
OUTCOME
How the organization thought about the warehouse changed: instead of reacting to problems as they surfaced, the goal became designing for reliability at scale, and operations went from a back-office function to something recognized as part of the care experience itself. The eight design principles and future-state workflow recommendations gave the warehouse and design teams something concrete to plan from, rather than each team working off its own assumptions. Patient satisfaction scores sat on one side of what the recommendations were built to move, cost of care and hospital readmissions on the other, with order accuracy and fulfillment speed set as the operational metrics the team would track post-implementation to prove any of it out.
What do you do when employees have all the technology they need, but still can't get their jobs done?
CHALLENGE
Employees across a large academic healthcare system were struggling with its digital workplace. The challenge was understanding whether very different roles — from clinicians to administrative and support staff — were experiencing isolated technology problems or a common underlying issue that should be prioritized enterprise-wide.
PROCESS
We combined large-scale survey analysis with interviews structured around role groups — physicians and nurses, but also security officers, food service, and skilled trades — deliberately sampling roles that don't usually get asked about their digital tools together, instead of defaulting to clinical staff alone. The survey showed us how widespread the dissatisfaction was; it couldn't tell us why it differed so much by role, or how far any one pattern actually held across a workforce this varied. Only the interviews could do that.
"Logging into [the system] and the computers is a huge pain — I had to restart it three times just to log in and get set up for telehealth. I was late to my visit, even though I'd started 25 minutes early." — Clinician Interview
What that structure surfaced was a pattern nobody had named yet: across very different roles, employees were adapting their own work to the technology instead of the other way around. Nurses hunting for the few working computers because training hadn't kept pace with rollout was one version of it. We turned that cross-role pattern into a workforce experience framework.
OUTCOME
The work shifted the conversation from fixing individual tools to treating the digital workplace as one connected employee experience. Because this is a healthcare system, that reframing carried real weight: closing the gaps this research surfaced meant protecting patient safety, not just convenience. The maturity framework we built gave leadership a way to lift staff productivity internally — moving roles from a foundational level of digital experience toward one with fewer technology-driven workarounds — and gave them a common language for where to prioritize investment first.
How do you find new growth in a category the market assumes has already peaked?
CHALLENGE
A leading snack company held the largest share of the unflavored tortilla chip category, but that lead was slipping — down three share points over three years — as private-label and regional competitors chipped away at its position. On the surface, the category looked mature and undifferentiated. Leadership suspected the real opportunity was hiding behind outdated assumptions about who was actually buying and eating in the category.
"Don't dress up a tortilla chip in something that doesn't belong in the tortilla chip world. Stay authentic. Stay original." — Customer Interview
PROCESS
A category assumed to be mature needed more than a product tweak, so I anchored the research in the cultural and demographic shifts reshaping who was buying and eating in the category, not just in what people said they wanted from a chip. That meant pairing roughly 30 stakeholder interviews inside the organization, to surface which internal assumptions about the category were outdated, with quantitative and qualitative consumer research to test those assumptions against real behavior.
That combination surfaced a detail that reframed the growth strategy: a meaningful share of consumption happened without any dip at all. Consumers were choosing the chip first, not the accompaniment, which wasn't something the organization's product and marketing decisions had been built around. I used that insight, together with the demographic research, to define three growth pillars and map ten distinct opportunity spaces the organization could pursue, from defending its existing base to designing for occasions it hadn't been building for at all.
OUTCOME
The opportunity spaces gave brand and innovation teams a shared, research-backed way to prioritize where to invest instead of relying on category assumptions — built to move the number leadership actually cared about: category share. Around 20 concepts were prioritized for testing against the specific segments and occasions the research had identified, designed to lift concept desirability among those underserved segments, not developed from internal intuition alone.
10 hours of in-depth interviews
5 RESEARCH THEMES
5 FUTURE STATE JOURNEYS & Concepts
2 VIRTUAL SIMULATIONS WITH DEALERS & CUSTOMERS
18 hours of interviews
6 secret shopping trips
25 Research participants
4 ETHNOGRAPHIC diaries
3 global markets
1 National focus group
4,471 survey respondents
15+ concepts tested
How do you create useful guidance for an industry where change happens quickly, but reliable data is limited?
CHALLENGE
A national nonprofit representing independent restaurants needed its flagship annual industry report to be more than a survey recap. Restaurant owners were navigating volatile costs, staffing pressure, and a widening gap between what customers expected and what small operators could realistically deliver, and the report needed to turn hundreds of individual responses into something the industry could actually use.
"Flexible, creative survival is the only way through; rigidness is how you get left behind." — Chef Interview
PROCESS
Each year's report had to do two things at once: capture what had changed since the last cycle, and give operators something they could act on rather than data they'd already lived through. I led the survey design and analysis, then closed the loop with chef interviews and focus groups — over 40 chefs across 11 focus groups in the most recent cycle — because a national survey alone would tell us what was happening but not why operators were responding to it the way they were, and interviews alone couldn't tell us how widely any one pattern actually held across an industry this fragmented.
That pairing is what let me move the report from a data recap to a small set of named, actionable themes each year — organizing survey and interview findings into trends like protecting margins amid cost volatility, supporting the workforce beyond wages, and navigating the gap between rising consumer expectations and what independent operators could deliver — giving chefs, funders, and policymakers a shared vocabulary for what the industry was actually facing.
OUTCOME
The report became more than an annual snapshot. Each year's themes gave chefs, operators, funders, and policymakers language to describe what independent restaurants were facing, built on survey participation and geographic coverage that grew year over year so the research kept representing more of the operators it spoke for. That growing reach is what let the report credibly track year-over-year shifts in reported business performance and profit expectations, the business-facing read the industry used to judge whether conditions were genuinely improving.
27 Stakehollder interviews
26 In-depth customer interviews
31 Remote ethnographies
3000+ survey respondents
200k receipts
10 growth opportunity spaces identified
30+ concepts prioritized for testing
750+ survey respondents
90+ chef and operator interviews
Redesigning The
System Behind Care
SYSTEMS TRANSFORMATION + SERVICE DESIGN
In-Field Research
Workflow Analysis
Systems Mapping
Service Blueprinting
Future-State Workflow Concepts
51 interviews
75+ hours of on-site observation
11+ hours riding with delivery drivers
8 design principles delivered
Reframing the Digital Workplace as One Connected Experience
WORKFORCE RESEARCH + EXPERIENCE STRATEGY
Employee Survey & Interview Synthesis
AI-Assisted Qualitative Analysis
Quantitative Sentiment Analysis
Workforce Segmentation
Cross-Role Pain Point Mapping
Experience Maturity Benchmarking
Leading Practices Research
Stakeholder Workshops
Digital Employee Experience Strategy
22,897 survey responses
128 interviews
30+ days in-field observations


